Abnormal process parameters

A parameter is considered abnormal if it exceeds limits considered acceptable or exhibits unacceptable variation behavior.
Acceptable limits
The acceptable limits of a parameter are those that are measured over a range of normality and are obtained from:
- History: the time in which the asset has worked in a stable way or in its optimal conditions is analyzed.
- Asset manufacturer's recommendations.
- Process, production, or operations engineers: when the parameter depends on the interaction of the asset with the process or activity of the company.
- Normality assumptions: when there are no records or recommendations and a normality baseline is created assuming that an asset is in good condition.
- Analogy: when there are no records or recommendations and the baseline of another equal, similar, or equivalent asset is taken.
Sometimes the acceptable limits of a parameter may vary depending on other parameters that determine the operation of the asset. Some examples of these cases are:
- Variation of the temperature of the dielectric oil as a function of the load of a transformer.
- Variation of the RPM and generation current of a wind turbine depending on the wind speed.
- Variation of the flow of a pump as a function of the operating pressure.
When the acceptable limits vary, it is necessary to make a correlation between the two variables (also called normality curves) or to define acceptable limits from different modes of operation so that the inspector can determine if there is an anomalous parameter.
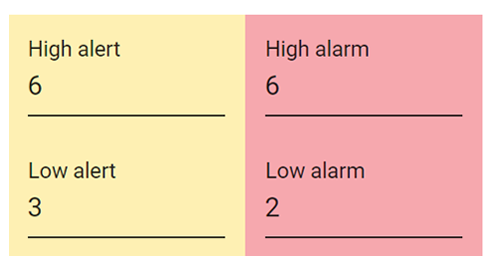
Alerts and alarms
The simplest criterion for diagnosing an abnormal process parameter is by comparing the parameter reading with pre-set alert and alarm levels.
The alert level indicates that the parameter has deviated from the acceptable or normal range with a deviation that may be tolerable and does not require immediate action on the asset or its process.
The alarm level indicates that the parameter has deviated from the acceptable or normal range with a high deviation that compromises the functionality of the asset or is an imminent risk. and requires immediate action on the asset or its process.
Alerts and alarms are defined for both high and low limits or for both (admissible range).
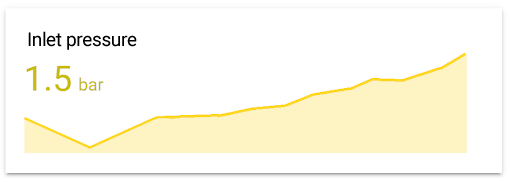
Trend analysis
Another criterion to diagnose an anomalous process parameter is the trend analysis of the parameter, which consists of seeing the variation and evolution of the parameter with respect to time.
The trend analysis may imply the alert and alarm criteria if they are defined. However, the trend allows the visualization of gradual upward and downward changes, which is considered a diagnostic criterion for an anomalous parameter. An inspector should consider that an abnormal parameter can be diagnosed without necessarily reaching an alert or alarm level.
Erratic variation of the parameter
They can see times when inspectors encounter parameter readings far outside the alarm level, reading errors, or outliers of the parameter. Most of the time this is due to errors in the measuring instrument or sensor. If a reading of the parameter can be made, it must be noted and, according to the inspector's criteria, an analysis of the reading should be made and recommend either checking the instrument or sensor or checking the parameter with an erratic reading with other equipment.
It is a good practice to diagnose an anomalous process parameter whenever an erratic variation of the parameter is found and there is no evidence that it is a problem with the instrument or sensor. The visual inspection report can clarify the diagnosis or propose possible causes of the anomalous parameter.
Parameters in online systems
Unlike data collection in the field, online (or permanent) systems provide more readings and more frequently, allowing for more complete analysis. In addition to the criteria for alert and alarm levels and trend analysis, online systems allow evaluating these criteria:
- Behavior cycles: you can see the variation of a parameter with respect to other cyclical external variables such as ambient temperature, operating shifts, or deposit levels. This allows considering these variations in the criterion of normality of the parameter analyzed.
- External events: you can see the variation of a parameter with respect to a specific event such as RPM increase, re-greasing, tank filling, overload and others. These events can cause changes in the analyzed parameter without necessarily signifying an alert or alarm.
- Changes in the condition of the asset visible in the reading of some parameter that later returns to its normal limit in the time between inspections.
Online systems allow adding criteria for evaluating the alert and alarm levels of the parameters based on consistency. This means that to evaluate an alert or alarm, a single reading outside the allowable range is not enough, rather you must have several consecutive readings outside the allowable range to diagnose an abnormal process parameter.