Corona discharge

Corona discharge begins when the electric field around an energized conductor exceeds the dielectric strength of the surrounding air and ionizes it. Although most of the released energy lies in the ultraviolet band, the ionization generates a small but measurable temperature rise that a high‑sensitivity infrared camera can record in real time. Detecting this heat lets technicians locate corona early, long before it erodes insulation, corrodes fittings, or forces an outage.
Because corona creates ozone, nitric acid, carbon deposits, and ultraviolet radiation—especially where dirt or moisture coat insulators—its chemical attack is relentless. Thermography translates that invisible chemistry into temperature deltas of only a few degrees Celsius, providing hard data that eyes and ears cannot see.
Infrared diagnosis offers three crucial advantages: it makes the discharge visible without contact, delivers numeric temperature differences for trending, and surveys long spans of conductors and hardware from a safe distance. A modern camera with ≤ 50 mK NETD and a telephoto lens reveals faint halos on grounded end fittings, crescent‑shaped warm spots on shield‑wire clamps, or narrow rings around bushing flanges—the classic thermal fingerprints of corona.
Dusk or night patrols give the best contrast because ambient cooling hides background features while corona heating persists. Inspectors should lock the camera span to about 10 °C, include a known good phase for reference, and save radiometric files so future surveys can track growth in ΔT.
Ultrasonic detectors and solar‑blind ultraviolet cameras can also diagnose corona, but only thermography shows how much heat is being injected into the asset. Combining the techniques is recommended—an ultrasonic hiss or UV spark pinpoints the site, and the thermal image confirms severity so maintenance can be planned.
Action thresholds vary by asset: a 4 °C rise above an adjacent phase on a suspension insulator usually warrants washing or replacement, while any measurable rise along a GIS bushing flange calls for immediate partial‑discharge testing. Always interpret numbers alongside load, weather, and historic baselines.
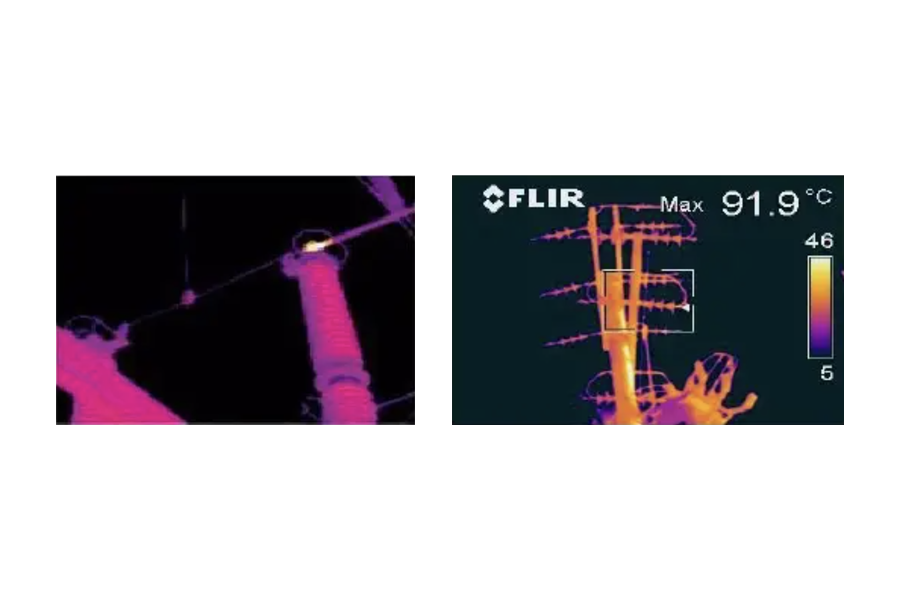
Safe working distances, arc‑rated PPE, and weather checks remain mandatory. Record ambient temperature, humidity, and load current with every image so trend data stay reliable. During a night patrol of a 132 kV line, a 5 °C hotspot appeared at the conductor–insulator junction on phase B. Ultrasonic follow‑up confirmed corona. After cleaning, the ΔT fell below 1 °C and the ozone odor vanished, proving that thermography had caught the fault early.
Early detection of corona with thermography preserves insulation integrity, prevents forced outages, and avoids costly emergency repairs. The modest investment in sensitive cameras and routine patrols pays back quickly in avoided failures.