Integration of visual inspections with other techniques

From a maintenance management perspective, visual inspection is a predictive technique on the same level as vibration analysis, ultrasound, oil analysis, thermography, etc. Understanding this concept, the need to integrate the data and information collected in visual inspections with the rest of predictive techniques is understood. This integration is the great goal of the digital transformation of visual inspections.
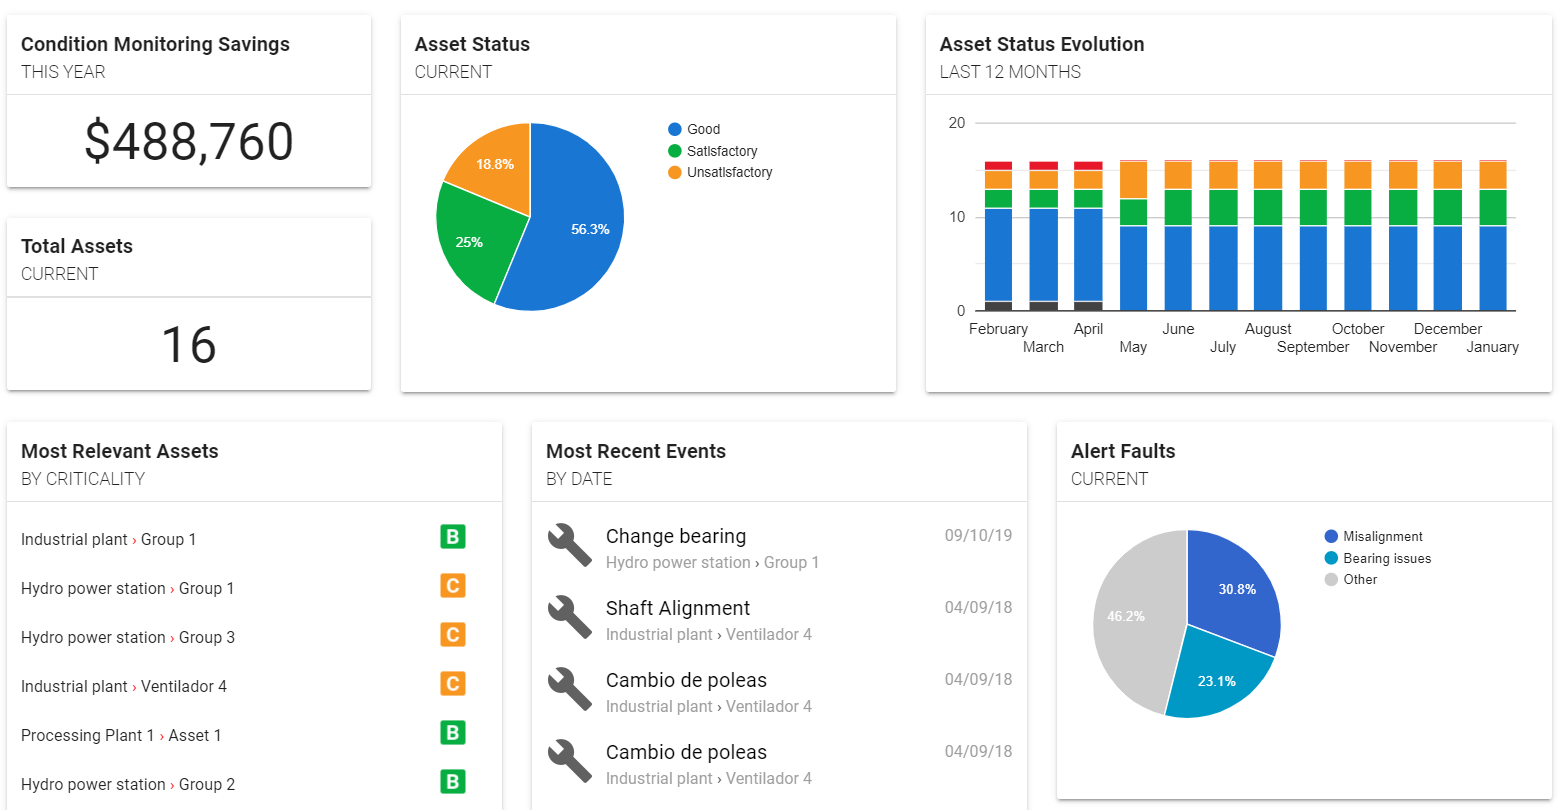
Managing visual inspections as yet another predictive technique implies that data, reports, recommendations and work orders are to be issued from visual inspections. On the other hand, it also implies that the statistics, indicators and calculation of savings will also be made taking into account the visual inspections.
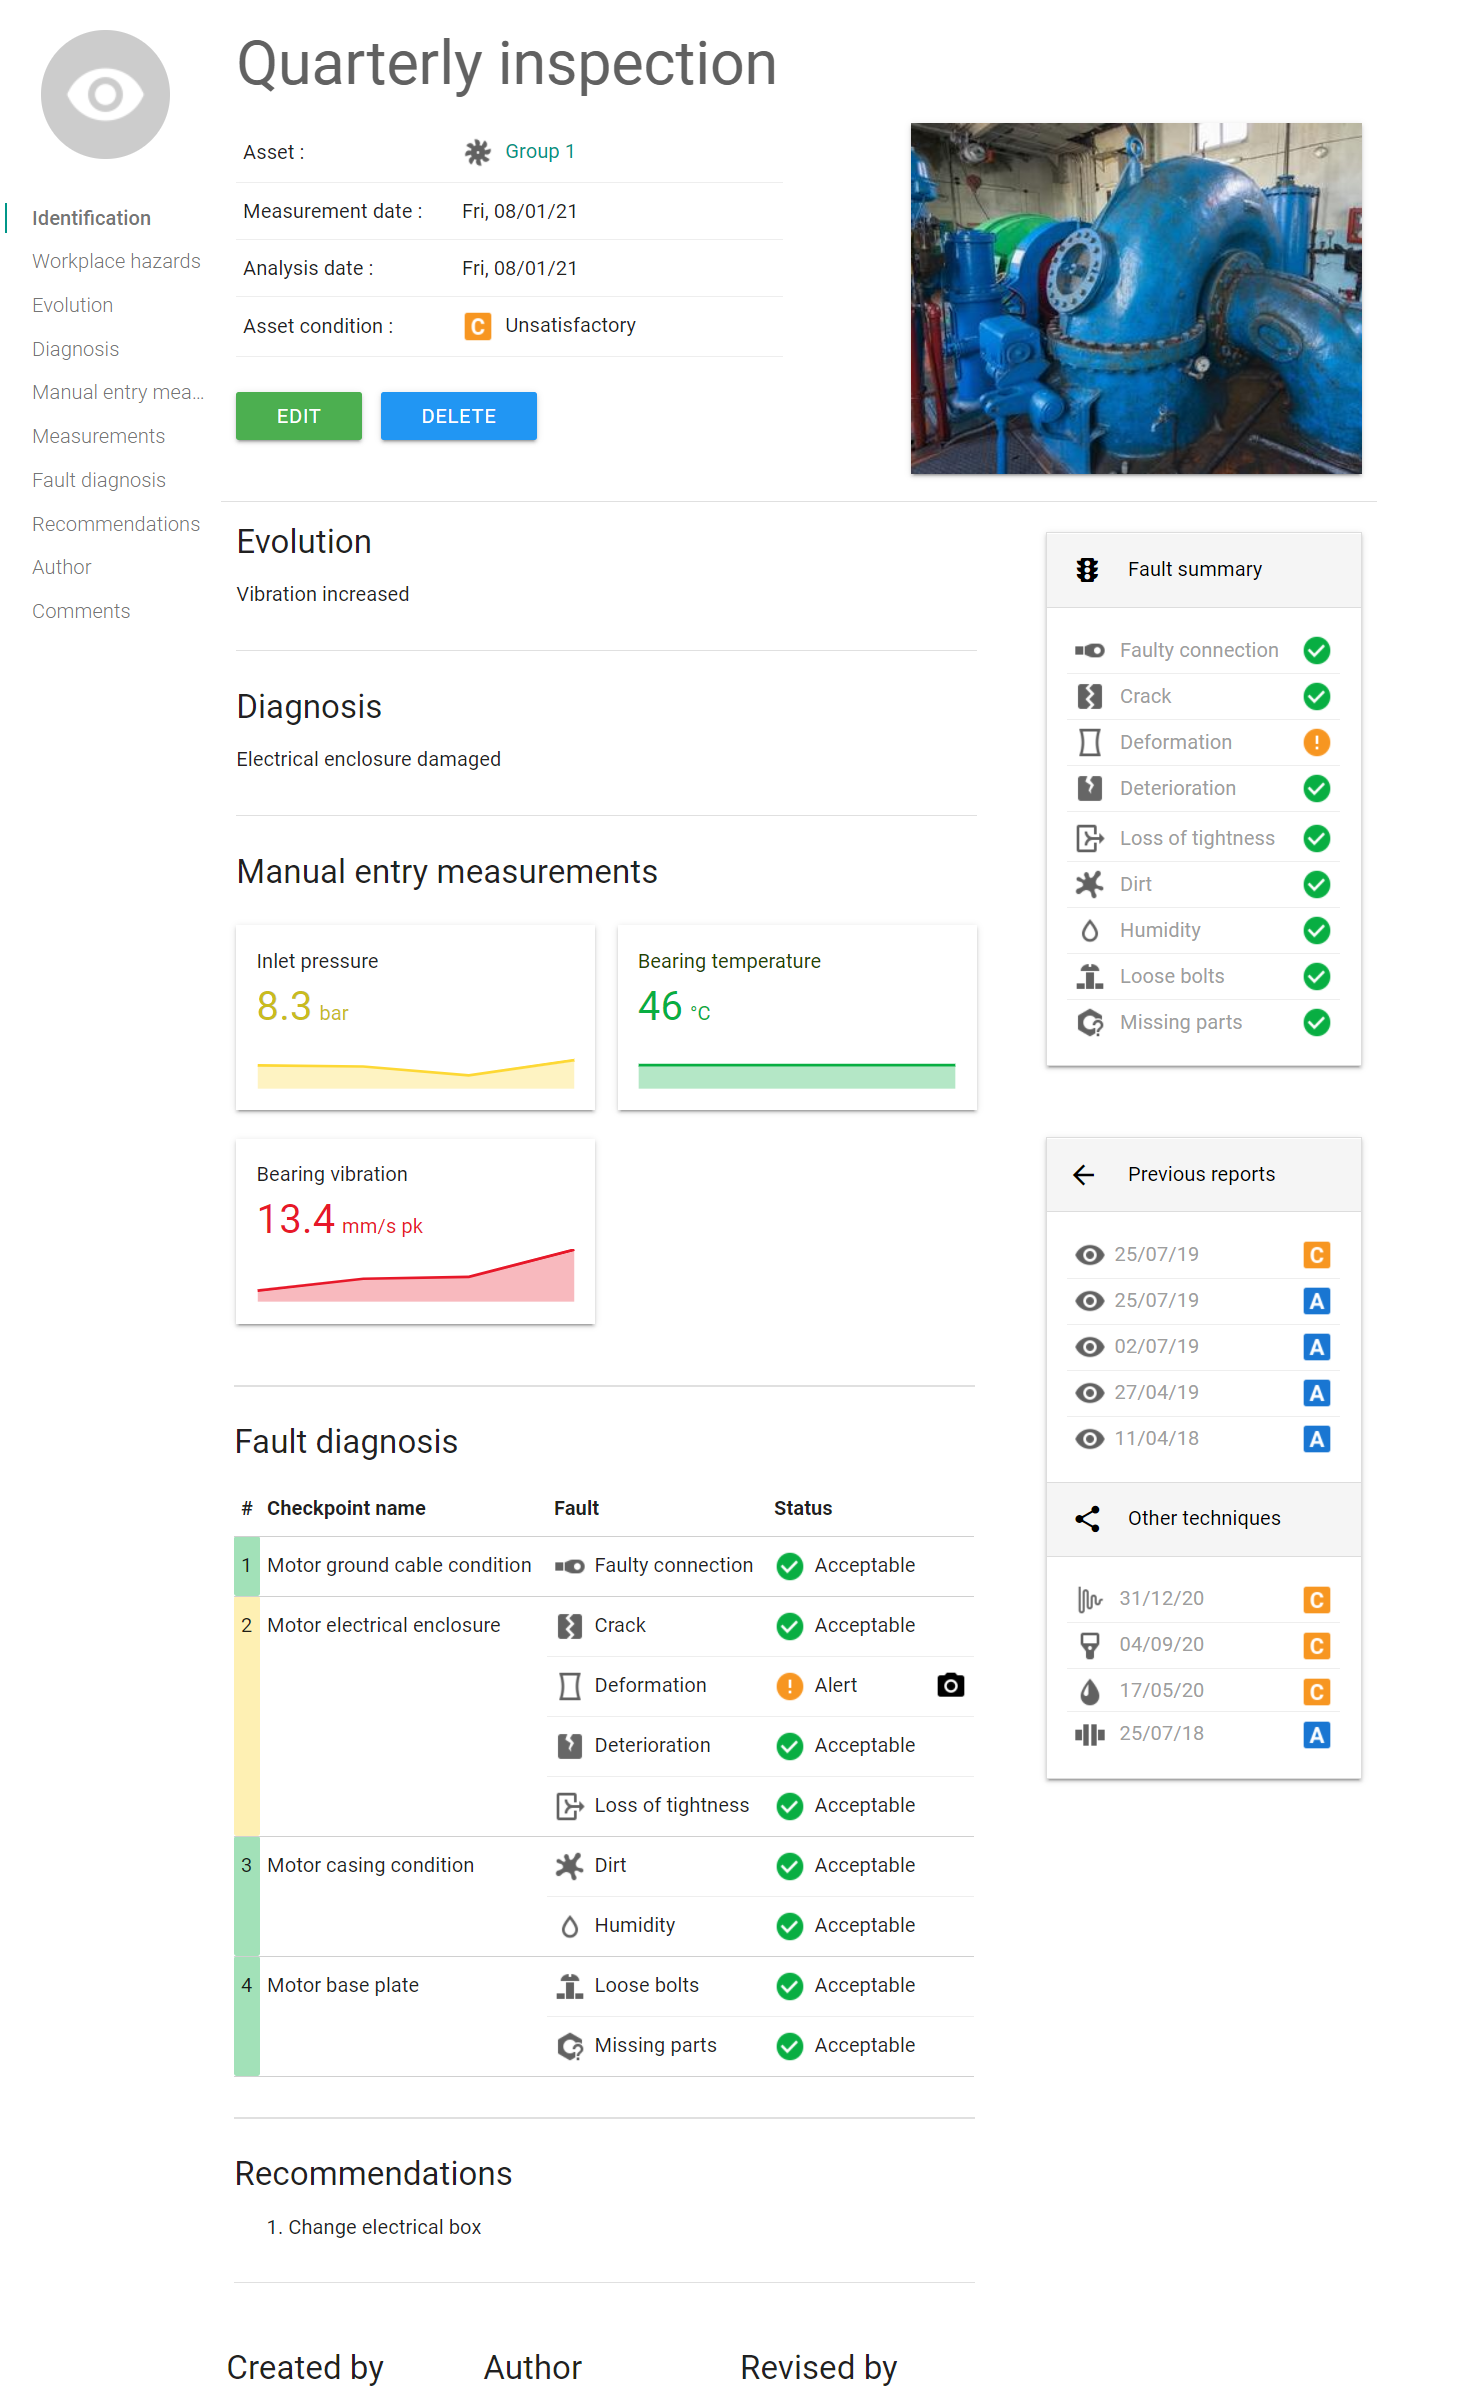
The first level of integration involves treating visual inspection as one more predictive technique, therefore reports, work orders and data visualization are issued with the same characteristics and functionalities as is done in other predictive techniques. Likewise, trend analysis is performed on the collected parameters and they are displayed in the reports.
The second level of integration consists of combining the collected data with data from other predictive techniques for consolidation, statistical calculation of indicators and generation of control panels. This level of integration also involves the consolidation of data generated in procedures such as work orders, calculating savings for predictive maintenance, root cause analysis and failure statistics.