Demodulation or envelope analysis

The use of demodulation or envelope analysis is an excellent complementary tool to improve spectral analysis in the detection of defects in bearings and gearboxes. This section describes what is demodulation and its applications.
What is demodulation?
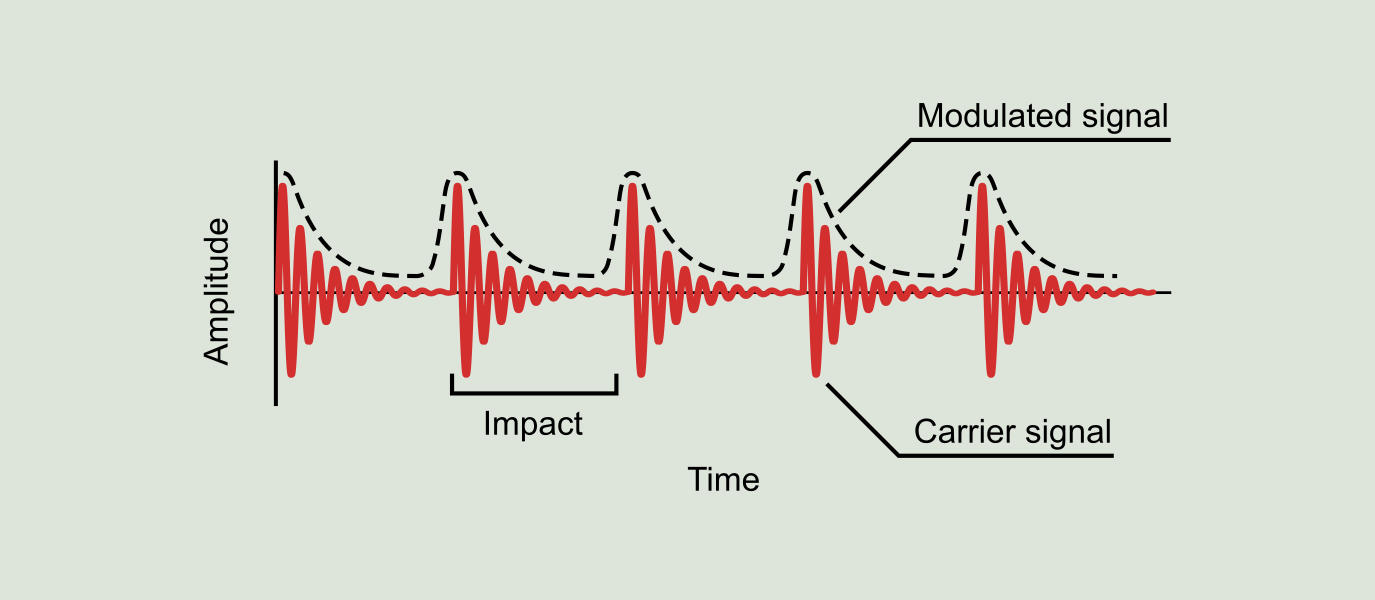
Demodulation can be explained with the following example: suppose we have a bearing with a defect in the outer race, as show in Figure 9.7. Each time a ball passes over the defect, it generates a small impact that we hear as a "click". If, for example, the BPFO (outer race failing frequency) of the bearing is 6.2, in other words 6.2 balls pass over the defect during each shaft revolution, we will have 6.2 "clicks" per revolution. If we measure the vibration in this bearing during a complete revolution of the shaft we will obtain a waveform as represented in red color in Figure 9.15.
When analyzing the vibration generated by this bearing (see Figure 9.16), we find BPFO harmonic peaks, that is, at a frequency equal to 6.2 times the rotating speed of the shaft. Such peaks are directly related to this defect in the bearing. However, the vibration signal contains more information, as we can see in the standard spectrum, and therefore the question arises: what is that other information?.
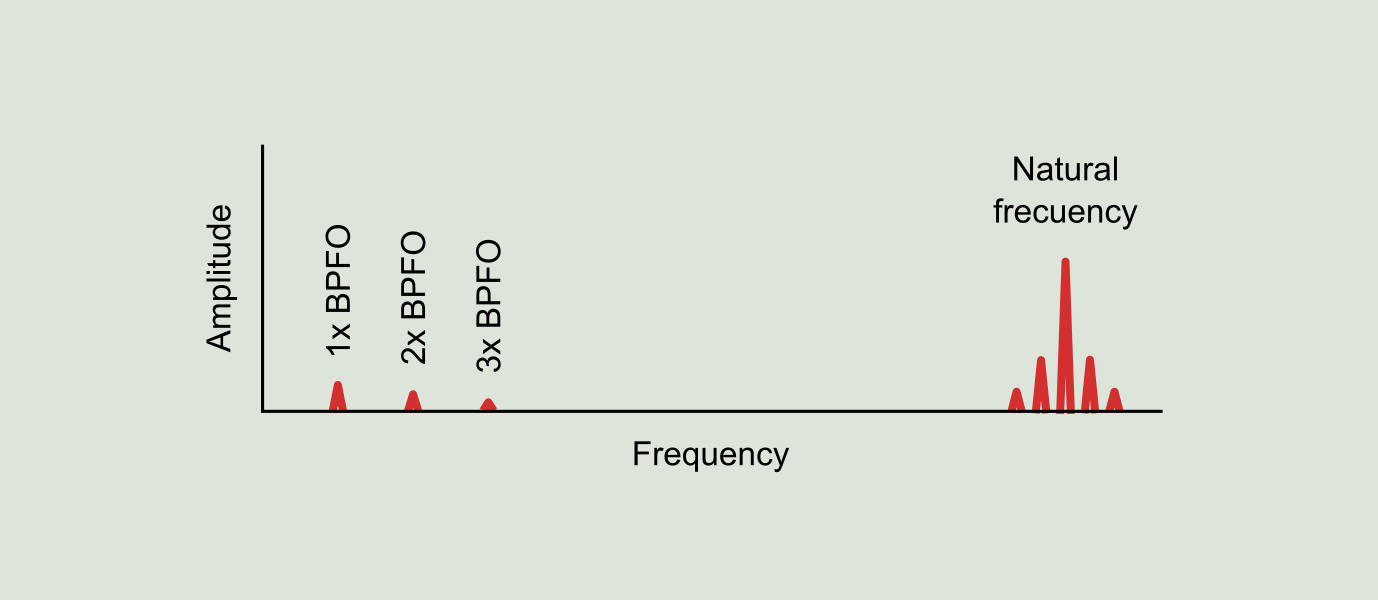
The impact generated when each ball of the bearing encounters a discontinuity is the same the bearing does when hit with a hammer, similar to a bell that is hit with a hammer. The structure, formed by the bearing, its support and the machine shaft, all together act as a resonance bell. The sound it makes when a ball strikes the defect corresponds to a certain frequency, called the natural frequency or resonance frequency, which is typically a high frequency, in a range between 1 and 20 kHz depending on the mass and the stiffness of the bearing, and is not only concentrated on some particular frequencies, but on frequency bands. This resonance frequency is a property of the structure and is not affected by how many times is hit or how intense is the impact.
With this in mind, we can see from another point of view the vibration associated with this defect: considering that the bearing or "bell" is all the time ringing and when the defect is hit by the ball this simply sounds louder. This variation effect on the amplitude of the natural frequency is known as amplitude modulation and can be clearly seen in Figure 9.15, where the natural frequency acts as a carrier signal and the BPFO signal acts as a modulated signal.
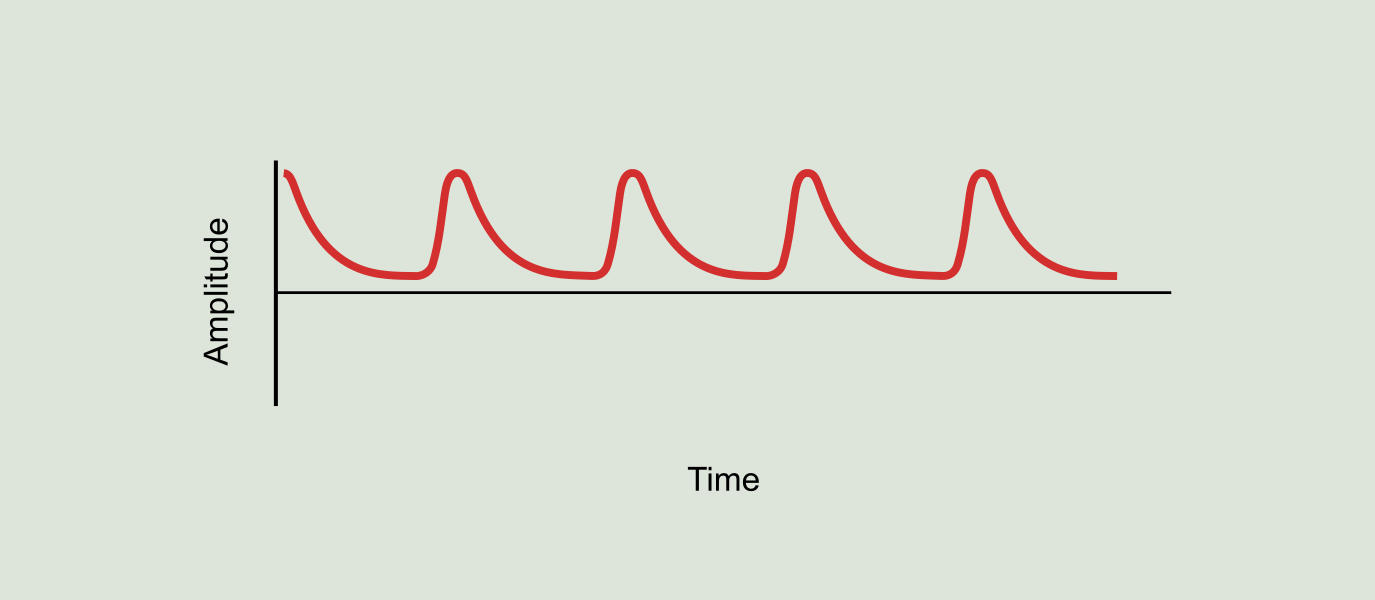
The demodulation process consists in obtaining from the original vibration of Figure 9.15 a new signal containing only the modulated signal, as shown in Figure 9.17. This new signal is also known as the original signal envelope. The demodulated signal spectrum is called the demodulation spectrum (see Figure 9.18) and contains harmonic peaks at the "ringing" frequency (BPFO) of the original vibration signal.
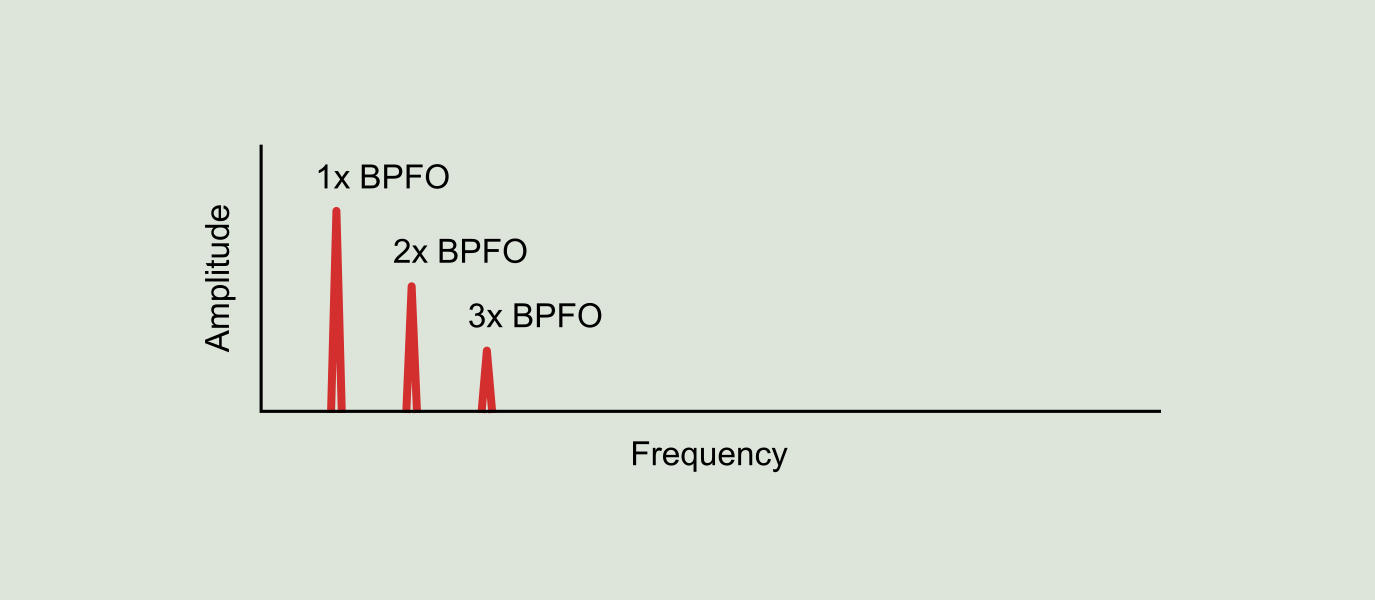
In summary, we can see in two different places and in two different ways the effects of the balls hitting a defect in a race. One can be interpreted as the number of impacts per revolution of the shaft: if 6.2 balls hit the defect by revolution of the shaft we can see a peak in the vibration spectrum at a frequency of 6.2xRPM (BPFO). Another way is to see it is in terms of resonance frequency of the bearing structure: the bearing housing sound louder 6.2 times per revolution of the shaft and if we demodulate the signal we will have a peak at 6.2xRPM (BPFO).
Therefore, there are essentially two different ways to get to that 6.2xRPM (BPFO), which tells us that a problem is developing in the bearing.
Why use demodulation?
At this point the following question should be asked: if it is possible to identify bearings problems with a technique, why should we bother about another alternative?. The use of demodulation in fault diagnosis is extremely useful because it provides the analyst with the following capabilities.
Readings with lots of random vibration
One reason to use demodulation is the existence of machines, such as pumps or blowers, that due to their own operation generate a large amount of random vibration that increases the background noise in the spectrum. This noise level can bury the harmonics associated with the bearing failing frequencies in the standard spectrum. In addition, the background noise produced by random vibration is often similar to that caused by severe bearings wear, which may cause such wear to go unnoticed. Demodulation can be extremely useful in this situation.
Very low speed readings
Demodulation is also very useful for diagnosing problems in rolling element bearings of very low speed machines. If you have a machine that turns at 60 RPM (1 Hz) and you want to find bearing frequencies in a range between 3xRPM and 10xRPM, the frequency of those harmonics will be lower than 10 Hz. When working with vibration spectrum in velocity, the necessary integration from acceleration into velocity acts as a 10 Hz high pass filter, making these low frequencies almost undetectable. Fortunately, the demodulated data will remain valid since the bearing resonance frequency is at high frequency.
Early detection
Demodulation allows for the earliest possible detection of a bearing failure, since the bearing failing frequencies that appear in the demodulation spectrum are the first indicator of the begining of a bearing issue. Demodulation can detect such failing frequencies before they become strong enough to appear in the standard spectrum.
Enhanced diagnostic capabilities
If a peak occurs at a given frequency in the demodulation spectrum, it is most likely a bearing failing frequency. Then, can be expected that it will also appear in the standard spectrum as the deterioration progresses. Conversely, if a strange peak, non-synchronous with the shaft rotating frequency, appears in the standard spectrum, and it also appears in the demodulation spectrum, then it is possible to be sure that it is a bearing failing frequency. Finally, if we notice bearing failing frequencies in the standard spectrum at two different machine locations and these frequencies appear in the demodulation spectrum of one location but not in the other, then we can conclude that the location at where it appears is the one that has a bearing problem.
Why not just use demodulation?
Unfortunately, it is not possible to use exclusively the demodulation spectrum as the only diagnostic tool because it does not allow to correlate of the amplitude of the fault frequencies with the bearing damage condition. The reason for this is that as the bearing deterioration progresses, the number of defects in the bearing increases, causing the demodulated signal to become more and more random. Therefore, as the bearing damage progresses, the harmonics in the demodulation spectrum will lose amplitude, and may even disappear.
In addition, the peak level in the demodulation spectrum is simply relative to how noisy the "clicks" are compared to the bearing background noise. This ratio, on its own, is not sufficient to correlate with the severity of the bearing failure.