Visual Inspections as the Cornerstone of Condition-Based Maintenance: A Comprehensive Framework for Integration into Condition Monitoring Programs

When I talk to maintenance managers, many are surprised when I tell them that visual inspections are the first condition monitoring tool that should be used in any company before investments in more sophisticated instruments and online systems. Rare is the company that has a visual inspection plan fully integrated with condition-based maintenance data. In most cases, visual inspections are carried out informally, often by production personnel using paper checklists. These checklists are usually filed away with no further analysis, no systematic storage of data, and no communication to the predictive maintenance team. Abnormal findings are seldom documented in a way that informs and enhances maintenance decision-making.
When an asset-intensive company wants to begin its condition-based maintenance journey without a large budget, the best recommendation is to start by digitizing its visual inspections. This must be done using a proper methodology, grounded in asset analysis and aligned with the company’s reliability goals. This approach ensures that the data collected visually—basic, accessible, and often low-cost—is effectively integrated into the predictive maintenance (PdM) framework. Visual inspections are fundamental because they provide the first layer of defense against failures. They are accessible, intuitive, and can detect many common asset issues, including leaks, loose bolts, dirt, and corrosion, long before advanced instruments detect a subtle anomaly.
Visual inspections matter because they give organizations the opportunity to identify, record, and communicate asset conditions in real-time. They are the gateway into data-driven maintenance strategies, serving as a baseline for other PdM technologies such as vibration analysis, thermography, ultrasound, and oil analysis. When performed systematically, visual inspections can improve safety, reduce costs, and enhance the reliability of machinery. In an era where companies strive for digital transformation, the humble visual inspection—digitized, standardized, and integrated—is a powerful driver of operational excellence.

Why Visual Inspections Are Important for Condition-Based Maintenance
Visual inspections predate all modern condition monitoring methods. Before sensors, software, and predictive analytics, maintenance technicians relied on their senses—particularly sight—to determine an asset’s condition. Today, while digital technologies can detect microscopic anomalies, visual inspections remain essential. They are easy to implement, cost-effective, and capable of detecting a wide range of failures.
Visual inspections excel in identifying issues that are often missed by instrumentation. For example, a production line operator might notice an oil leak, peeling paint on a tank, loose bolts on a machine’s housing, or discoloration around bearings. These visible cues are critical, as they can signal underlying problems: lubrication issues, corrosion, structural weaknesses, or abnormal temperatures.
By properly designing and integrating visual inspections into the predictive maintenance plan, companies can leverage these basic but invaluable data points. The integration ensures that issues detected visually are stored digitally, processed, and correlated with data from other PdM technologies. The outcome is a more holistic understanding of asset condition, cost savings from early failure detection, and improved decision-making.
The Importance of Visual Inspections in Asset Management
Visual inspections are nondestructive tests that rely on the visible portion of the electromagnetic spectrum. Whether through the naked eye, optical aids, borescopes, or drones, inspectors detect changes in surface conditions, shapes, colors, and configurations. Historically, the theory and academic development of visual inspection have roots in the nondestructive testing (NDT) field. Today, in predictive maintenance, visual inspections are recognized as key to monitoring asset condition.
Incorporating visual inspections into an asset management framework aligns with internationally recognized asset management standards. By integrating visual inspection data with reliability-centered maintenance strategies, companies can reduce Mean Time Between Failures (MTBF) and extend asset lifespan. Visual inspection data ensures that maintenance decisions are based on a complete picture. For instance, if vibration analysis flags an alert, a quick visual check might confirm loose bolts or dirt in cooling fins.
Visual inspections are versatile. They can monitor the condition of virtually any tangible asset. They require minimal training and basic instrumentation. Even as digital transformation advances and advanced predictive tools gain prominence, visual inspections remain the bedrock of condition monitoring. Without a structured approach, however, companies risk underutilizing this technique and failing to integrate findings into the broader PdM ecosystem.
Documented Workplace Hazards
Performing visual inspections exposes inspectors to workplace hazards. Safety is paramount. Before inspectors collect data, they must be aware of potential risks in the environment. Among common hazards are working at heights, electrical risks, moving machinery parts, chemical exposure, confined spaces, and loss of footing or balance. Each inspection route should highlight these hazards so inspectors can take preventive measures, wear proper personal protective equipment (PPE), and follow site-specific protocols.

By digitizing visual inspections and using tablets or smartphones, companies can automatically inform inspectors about known hazards before they approach an asset. This integration of occupational safety into the inspection plan prevents accidents and ensures compliance with workplace health and safety regulations. Safety guidelines and risk assessments should be embedded in the maintenance management system, so that inspectors receive reminders and instructions during each inspection route.
Detectable Failures by Visual Inspections
Visual inspections can detect a wide range of failures. Each failure type corresponds to observable symptoms:
- Abnormal process parameters: Readable indicators such as gauges or flowmeters might show out-of-range values.
- Obstruction: Filters, pipes, ducts, or valves might be blocked by dirt, debris, or foreign objects.
- Breaks: Visible cracks, fractured parts, or broken components.
- Deformation: Bent or warped structures, distorted shapes of pipes, housings, or machine guards.
- Deterioration: Gradual wear, erosion, rusted parts, peeling paint, or degraded materials.
- Dirt: Accumulation of grime, dust, oil, or grease on surfaces, filters, or sensitive components.
- High temperature: Discoloration, melted insulation, heat-induced deformities, or the reading of a temperature gauge outside normal ranges.
- Humidity: Condensation, mold, or moisture in areas that should be dry.
- Leaks: Escaping fluids, oil drips, steam, gas leaks, or visible staining around seals and joints.
- Loose bolts: Fasteners that have backed out or are visibly loose, causing vibration or misalignment.
- Bad connection (electrical): Burn marks, discolored terminals, loose wires, or evidence of arcing.
- Loss of tightness: Tanks or vessels no longer sealed, allowing fluid or gas to escape.
- Lubrication problem: Lack of lubricant, contaminated grease, foaming oil, or improper lubricant color.
- Maladjustment: Components out of alignment, shaft misalignment, or improper fit of parts.
- Missing components: Parts or accessories not present where they should be.
- Abnormal noise: A hissing leak, squeaking belt, rattling housing, detected by the inspector’s hearing.
- Corrosion: Rust, pitting, or oxidation on metallic surfaces.
- Structural problems: Cracks or instability in supports, foundations, walkways, or frames.
By defining these failure modes and training inspectors, visual inspections become a standardized technique. Instead of vague observations, inspectors report known failure categories, enabling quicker analysis and decision-making.
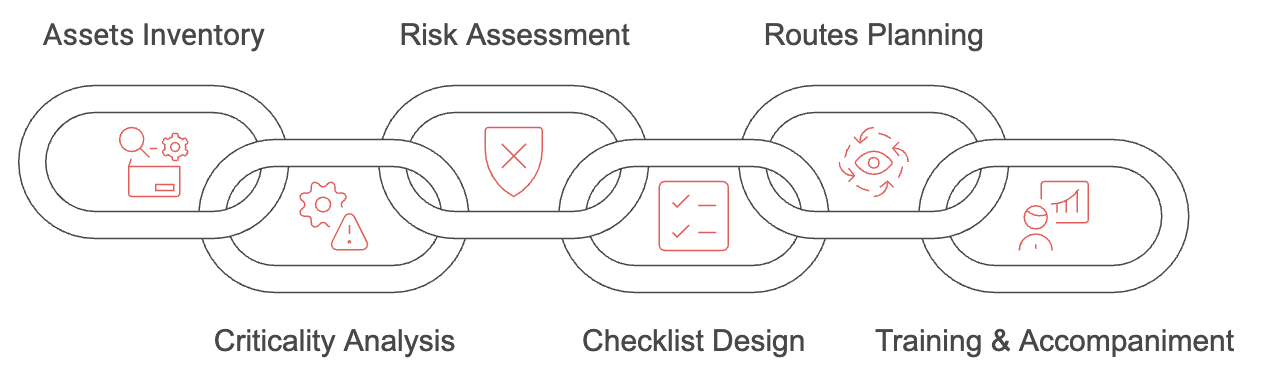
Methodology: The Visual-PdM Framework
Implementing visual inspections in a systematic, data-rich manner involves several steps. Think of it as a continuous cycle that integrates visual inspections into a predictive maintenance plan.
Asset Inventory and Classification
Start by creating a hierarchical taxonomy of all assets. Classify them by criticality, considering their function, downtime impact, safety implications, and historical failure data. Critical assets may require more frequent inspections or condition-based triggers.
Visual Inspection Surveys and Guidelines
Define inspection points for each asset. For every point, specify the normal condition, potential failures, acceptable parameter limits, and measurement units. Integrate this information into the inspection guidelines or checklists. By doing so, inspectors have a reference that ensures uniformity and consistency.
Instrumentation and Optical Aids
Visual inspections go beyond the naked eye. Lighting fixtures, magnifying glasses, mirrors, borescopes, endoscopes, temperature indicators, pressure gauges, and vibrometers can improve accuracy. Consider tablets or smartphones with built-in cameras for documentation. Fiber optic lights, halogen lamps, and flashlights help inspect dark, confined spaces. Some inspections may require specialized tools like Vernier calipers, micrometers, or dial indicators for dimensional checks.
Digital Integration
Digitizing inspections is crucial. Tablets and smartphones replace paper forms, eliminating the need for double data entry. Data is recorded in real-time, accompanied by photographs, voice notes, and parameter readings. Once inspections are complete, data syncs automatically with a predictive maintenance platform. There, it can be correlated with vibration, thermography, or oil analysis results. This integration is the cornerstone of predictive maintenance, allowing for holistic asset health assessment.
Task Design and Safety Integration
Each inspection route should include instructions on occupational hazards, required PPE, and safety procedures. For example, before an inspector checks a pump in a confined space, the tablet should display hazard warnings. Likewise, if vibration data suggests a failure mode, the inspection route can adjust dynamically to focus on that particular machine.
Route Planning and Optimization
Optimizing inspection routes saves time and resources. Proprietary algorithms can factor in asset locations, criticalities, and triggers from condition-based measurements. For instance, if thermography flags a hotspot, the next inspection round includes a focused visual check of that area. This adaptability ensures timely detection of emerging issues.
Training and Continuous Improvement
Train inspectors to recognize failures and use digital tools effectively. Over time, review data to improve guidelines and refine inspection frequency. Analyze trends in failures, compare them with other PdM data, and adjust strategies. Continuous improvement ensures that visual inspections evolve with the plant’s conditions, new technologies, and lessons learned.
Practical Considerations, Integrative Applications
Case studies highlight the benefits of integrating visual inspections with other PdM techniques. Consider a power plant that uses vibration analysis to detect anomalies in turbines. When vibration levels exceed a threshold, the plant dispatches an inspector to check for visible issues: leaks, loose bolts, or structural cracks. If the inspector finds loose bolts, the maintenance team tightens them promptly, avoiding a potentially catastrophic failure. This synergy reduces downtime and saves costs by intervening early.
Another example might involve drones for inaccessible areas—like the top of a wind turbine’s nacelle. Instead of sending personnel at height, a drone equipped with a camera performs the visual inspection. If the drone captures images of blade deformation or cracks, the maintenance team plans corrective actions. Similarly, robots in confined spaces can perform video-endoscopy to detect internal pipe corrosion without exposing inspectors to dangerous environments.
Wearable technology, augmented reality (AR), and virtual reality (VR) further enhance training and remote assistance. AR can guide inspectors by superimposing instructions on the live camera image, pointing out inspection points, risk areas, or known trouble spots. VR can be used for training, simulating real-world inspection scenarios in a safe environment.
All these tools and techniques, when integrated into one predictive maintenance ecosystem, amplify each other’s effectiveness. Visual inspection data can confirm suspicions raised by sensors, provide context for abnormal readings, or guide more advanced tests. The result is a robust, multi-layered defense against failures and inefficiencies.
Monitoring, KPI Measurement, and Long-Term Optimization
To ensure continuous improvement, maintenance managers must track Key Performance Indicators (KPIs). Examples include:
- Inspection Coverage: Percentage of identified inspection points actually checked per route.
- Data Quality: The completeness and clarity of inspection records, including photos and parameter readings.
- Response Time: How quickly abnormal visual findings trigger corrective actions.
- Failure Rates: Reduction in unexpected breakdowns as a result of timely visual detection.
- Cost Savings: Quantifiable reduction in maintenance costs due to early intervention and fewer catastrophic failures.
Trend analysis over time allows companies to refine inspection intervals, inspection routes, and trigger thresholds. As machine learning (ML) and artificial intelligence (AI) tools advance, visual data can be processed automatically to detect anomalies. Image recognition algorithms can identify corrosion spots or cracks, flagging issues without human intervention. Combined with historical data, AI-driven tools can predict which assets are at highest risk, guiding inspectors to the right place at the right time.
In the long term, integrating visual inspections into a strategic predictive maintenance plan means that these inspections become more than a stand-alone activity. They serve as a key input into a broader ecosystem of data and analytics. The company’s maintenance culture shifts from reactive to proactive, supported by stable and reliable data streams from multiple sources.
Conclusion
Visual inspections, though often undervalued, form the foundational layer of any robust predictive maintenance strategy. They provide immediate, intuitive insights into asset conditions. By formalizing visual inspections through proper design, digitization, and integration, companies can convert a simple, low-cost technique into a powerful predictive maintenance tool. As digital transformation reshapes industrial maintenance, visual inspections become indispensable data feeders, complementing and enhancing advanced condition monitoring technologies.
Carlos, by embracing a structured methodology—such as the Visual-PdM framework—you ensure that your visual inspections are no longer just a formality or a paper exercise. Instead, they become dynamic components of a data-driven strategy. This approach leads to improved safety, significant cost savings, increased equipment reliability, and ultimately, a stronger competitive edge.
Key Takeaways
- Start your condition-based maintenance journey by digitizing visual inspections.
- Integrate visual inspection data with other predictive maintenance techniques.
- Use standardized failure categories and guidelines to enhance consistency and data analysis.
- Incorporate occupational safety into every inspection route, ensuring inspector well-being.
- Optimize inspection routes with algorithms and adapt inspection frequencies based on real-time data.
- Embrace new technologies such as drones, AR, VR, and advanced lighting systems to improve inspection quality.
- Continuously track KPIs, analyze trends, and adjust strategies for long-term optimization.
- Treat visual inspections as a core predictive technique, not an afterthought.
References
Armstrong, M. (2010). Condition Monitoring, Asset Management, and Maintenance. Industrial Press.
ASNT (2010). Visual Testing (VT) Handbook. American Society for Nondestructive Testing.
Beebe, R. (2004). Predictive Maintenance of Pumps Using Condition Monitoring. Elsevier.
ISO 14224:2006. Petroleum, Petrochemical and Natural Gas Industries—Collection and Exchange of Reliability and Maintenance Data for Equipment.
ISO 45001:2018. Occupational Health and Safety Management Systems—Requirements with Guidance for Use.
ISO 55000:2014. Asset Management—Overview, Principles and Terminology.
Jardine, A.K.S., Lin, D., & Banjevic, D. (2006). A Review on Machinery Diagnostics and Prognostics Implementing Condition-Based Maintenance. Mechanical Systems and Signal Processing, 20(7), 1483–1510.
Moubray, J. (1997). Reliability-Centered Maintenance. Industrial Press.
Maintenance Intelligence LLC. Designing a Comprehensive and Adaptive Visual Inspection Methodology for Integration into Predictive Maintenance Programs. Internal White Paper.
What is Power-MI?
Power-MI is a cloud based solution that allows you to design & manage your condition-based maintenance plan integrating all techniques into one platform. Easy reporting, automatic work orders and CMMS integration.
Read more
Comments (132)
pHqghUme
Sun, 03/08/2025 - 15:17
pHqghUme
Sun, 03/08/2025 - 15:17
pHqghUme
Sun, 03/08/2025 - 15:45
pHqghUme
Sun, 03/08/2025 - 15:45
pHqghUme
Sun, 03/08/2025 - 15:46
pHqghUme
Sun, 03/08/2025 - 15:46
pHqghUme
Sun, 03/08/2025 - 15:46
pHqghUme
Sun, 03/08/2025 - 15:46
pHqghUme
Sun, 03/08/2025 - 15:46
pHqghUme
Sun, 03/08/2025 - 15:46
pHqghUme
Sun, 03/08/2025 - 15:46
pHqghUme
Sun, 03/08/2025 - 15:46
pHqghUme
Sun, 03/08/2025 - 15:46
pHqghUme
Sun, 03/08/2025 - 15:46
pHqghUme
Sun, 03/08/2025 - 15:46
pHqghUme
Sun, 03/08/2025 - 15:46
pHqghUme
Sun, 03/08/2025 - 15:46
pHqghUme
Sun, 03/08/2025 - 15:46
pHqghUme
Sun, 03/08/2025 - 15:46
pHqghUme
Sun, 03/08/2025 - 15:46
pHqghUme
Sun, 03/08/2025 - 15:46
pHqghUme
Sun, 03/08/2025 - 15:46
pHqghUme
Sun, 03/08/2025 - 15:46
pHqghUme
Sun, 03/08/2025 - 15:46
pHqghUme
Sun, 03/08/2025 - 15:46
pHqghUme
Sun, 03/08/2025 - 15:47
pHqghUme
Sun, 03/08/2025 - 15:47
pHqghUme
Sun, 03/08/2025 - 15:47
pHqghUme
Sun, 03/08/2025 - 15:47
pHqghUme
Sun, 03/08/2025 - 15:47
pHqghUme
Sun, 03/08/2025 - 15:47
pHqghUme
Sun, 03/08/2025 - 15:47
pHqghUme
Sun, 03/08/2025 - 15:47
pHqghUme
Sun, 03/08/2025 - 15:47
pHqghUme
Sun, 03/08/2025 - 15:47
pHqghUme
Sun, 03/08/2025 - 15:47
pHqghUme
Sun, 03/08/2025 - 15:47
pHqghUme
Sun, 03/08/2025 - 15:47
pHqghUme
Sun, 03/08/2025 - 15:47
pHqghUme
Sun, 03/08/2025 - 15:47
pHqghUme
Sun, 03/08/2025 - 15:47
pHqghUme
Sun, 03/08/2025 - 15:47
pHqghUme
Sun, 03/08/2025 - 15:47
pHqghUme
Sun, 03/08/2025 - 15:47
pHqghUme
Sun, 03/08/2025 - 15:47
pHqghUme
Sun, 03/08/2025 - 15:47
pHqghUme
Sun, 03/08/2025 - 15:47
pHqghUme
Sun, 03/08/2025 - 15:47
pHqghUme
Sun, 03/08/2025 - 15:48
pHqghUme
Sun, 03/08/2025 - 15:48
Pages