How to Calculate Condition-Based Maintenance Savings

Calculating the savings by predictive maintenance allows us to justify all the investments in technology, services and personnel. It also serves as the foundation to calculate the ROI (Return or Investment) of condition-based maintenance.
In this article, we will explain in a simple way how to calculate the direct savings generated by predictive maintenance to be able to justify investments, gain visibility in the company (or client) and quantify the value that is contributed to the company.
I know companies that in a single diagnosis have shown to pay for the investment of one year's predictive maintenance. In the medium to larges plants, minimum savings are around $ 100,000. On average, they are between half a million and a million dollars annually. In cases of giant plants, I have seen proofs that exceed 5 million per year.
Accounting standards are made to describe the money transactions to and from the company. The problem in predictive maintenance or condition-based maintenance (CBM) is that we have to estimate an expense that was not executed. If we don't calculate the savings, we don't speak the same language as our finance department.
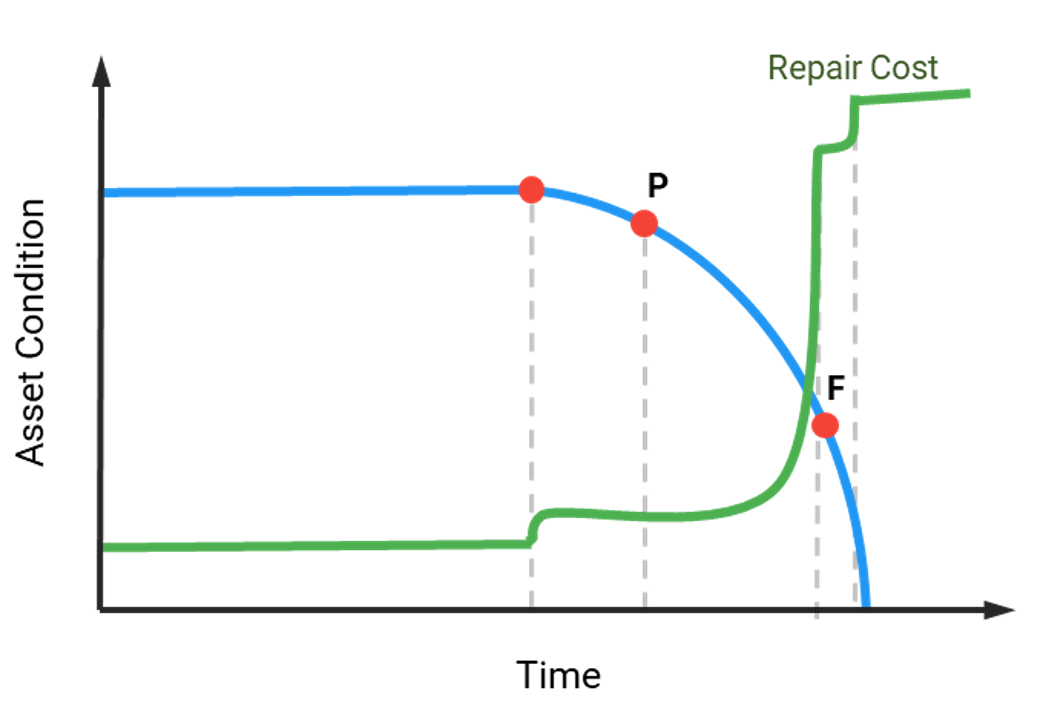
The P-F Curve is the basis of predictive maintenance. It is a graphical model to visualize an asset's condition versus time, as we saw in our article The P-F curve. We can detect a fault starting at P (potential failure), and F is when the asset cannot perform its function. All predictive maintenance efforts are to anticipate functional failure, point F.
Repair costs rise rapidly as the asset approach F, as shown in the figure:
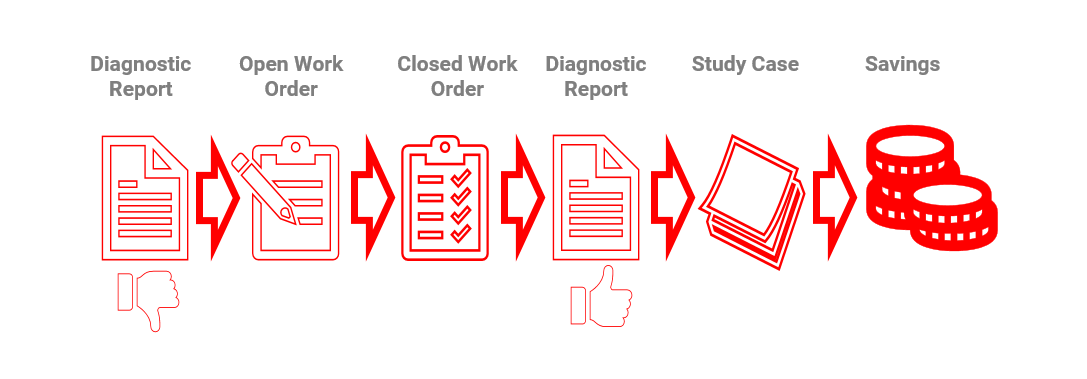
When a predictive analyst detects a potential failure in P-F time, he reports the fault; a work order is made from the report, a corrective repair is done. Upon completion, the analyst will check that the signals or symptoms that generated that failure have disappeared.
Well, the story doesn't end there. After we have verified that the fault has disappeared, we must document the case study. And it is for that case study that we will calculate the savings.
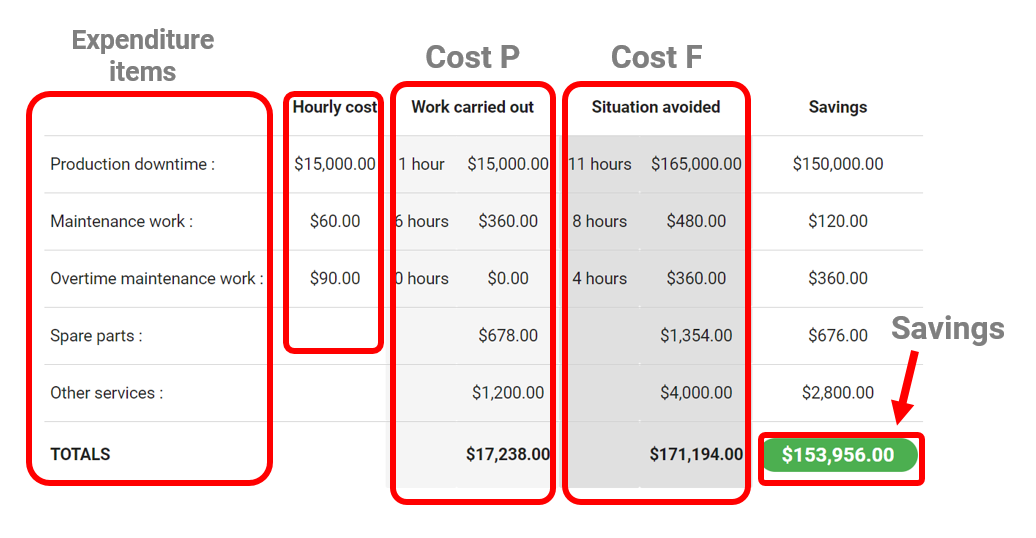
Savings is the difference between what we spent on the repair at the point of potential failure and what would have cost us to repair it if it had reached a functional failure. That difference is what we save our company.
Savings = CostF - CostP
If we start to calculate the savings in every case study and demonstrate the money saved over a whole year on verifiable evidence and data, the results are usually surprising.
How do we calculate the costs?
Well, the costs of a maintenance task are made up of:
- Personnel costs
- Contracted service costs
- Costs of parts
- Unexpected production shutdown costs
If we calculate the costs of these two scenarios: what it cost us acting on time (P) and what would have cost us if it had reached a functional failure (F) for not having predictive maintenance and calculating their difference, we obtain the savings.
We are only talking about direct costs. The significant savings are in the indirect costs, as shown by the Weinker model in the image. To calculate these indirect or hidden costs, it is necessary to interact with another department or unit of our company (production, quality, risk prevention, environment or others).

When I teach maintenance savings in my classes, students often tell me, "Well, but if you exaggerate everything, we will get millions of dollars in savings." This is not the case. At point F (when a functional failure is reached), the cost calculation is made based on records, data and without assuming a catastrophic situation. We collect documentary support as evidence.
Then later, students say to me, "And what is the problem? Why doesn't everyone do it?". Maintenance departments do not quantify the savings generated by predictive maintenance for these three main reasons:
- It is not known how to quantify the savings
- It is not a requirement of the plant management
- They do not have a management system where to do it
Calculating cost savings is an essential part of your condition-based maintenance (CBM) plan.
When you can show savings to your company, I assure you that proposing investments in predictive maintenance (buying equipment, hiring staff, digitizing procedures, doing root cause studies) will be much easier. Investments will be approved without problems.
At Power-MI, we have implemented condition-based maintenance (CBM) procedures to continuously calculate the savings, with documentary support and evidence collection. In the next article, I will teach you how to use this predictive maintenance management tool.
* Source: Wienker, Michael & Henderson, Ken & Volkerts, Jacques. (2016). The Computerized Maintenance Management System an Essential Tool for World Class Maintenance. Procedia Engineering. 138. 413-420. 10.1016/j.proeng.2016.02.100
What is Power-MI?
Power-MI is a cloud based solution that allows you to design & manage your condition-based maintenance plan integrating all techniques into one platform. Easy reporting, automatic work orders and CMMS integration.
Read more