Beating

The beating phenomena is the result of the interaction between two close frequencies that go alternatively in and out of synchronization. As you can seen in the waveform of Figure 6.10, a pulsation can be easily confused with amplitude modulation, when in fact it is two sinusoidal signals that are summed to form pulses. The spectrum clearly shows the frequency and amplitude of each component without the presence of any lateral bands. Since these signals are slightly different in frequency, their phase shift varies continuously from 0° to 360°, which causes their combined amplitude to constantly change, due to the reinforcement and partial cancellation that occurs. The highest vibration amplitude occurs when both signals are in phase and therefore, the two waveforms overlap. On the contrary, the lower vibration level occurs when both signals are 180° out of phase and therefore the two waveforms cancel each other out. In the waveform plot of Figure 6.10, the amplitude levels of the two signals are the same, thus completely canceling each other. Full cancellation is rarely seen in real plant measurements.
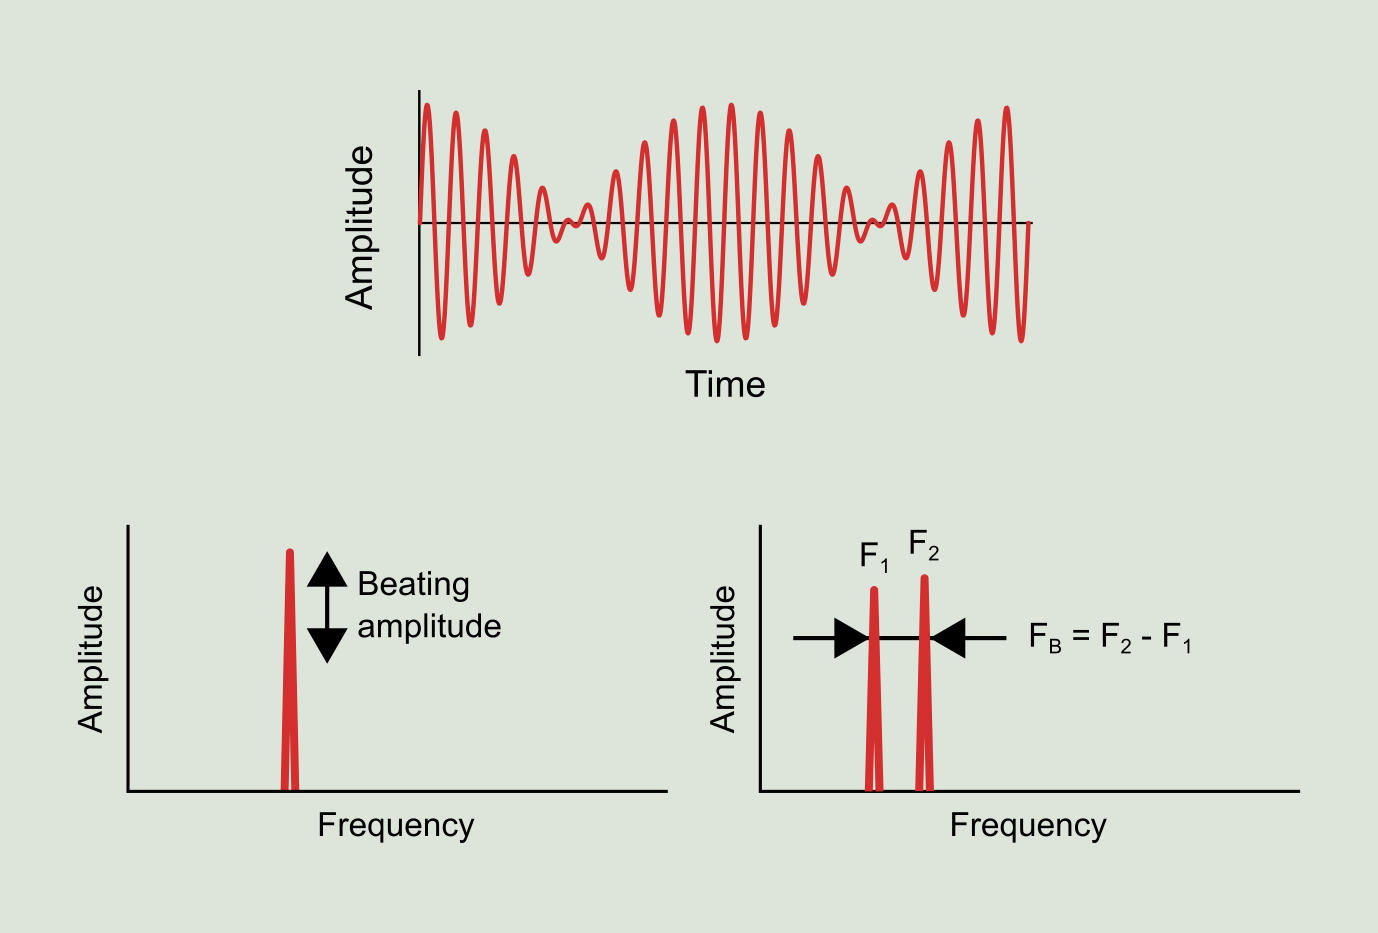
In a low-resolution frequency spectrum, only one peak appears, the amplitude of which rises and falls in a pulsating manner. If the spectrum is zoomed-in around this peak, you can see that in reality there are two very close peaks. The frequency difference between the two is called the beating frequency. It is not common to see the beating frequency in the spectrum since it is a very low frequency, typically in a range between 5 and 100 CPM.